BBA Data Debrief – August 2025
Written By: BBA Market Intelligence Manager Tatianna Turrentine-Long
The Birmingham Business Alliance (BBA) Data Debrief is back, but with a twist! This month’s report, written by BBA Market Intelligence Manager Tatianna Turrentine-Long, highlights the most recent release of the Cost-of-Living Index (COLI) summary for the past quarter and will explain what the COLI is, how it compares to other competing metros, and how it impacts wages. The COLI Quarterly report holds all of the calculated costs of living for metro areas in comparison to the national average cost of living. The Council for Community Economic Research collects data reported from regional communities, which includes the cost of everyday items and miscellaneous expenses that most consumers would pay for.
COLI Definition: The COLI is a price index that collectively measures the cost-of-living expenses across six broad categories: groceries, healthcare, transportation, housing, utilities, and miscellaneous goods and services.
How the COLI is Measured: The COLI is collected and measured at the metropolitan statistical area (MSA) level, which helps to summarize and capture the average cost of living in communities within the MSA.
Each category has a price index, and the overall average index for the MSA is calculated with all categories combined together. The collector contacts multiple businesses and organizations to gather the cost for each item that falls within each category. Each category has strict and concise rules on exactly what items are allowed to be included in the index. Once the prices are collected, a collective index is calculated for each participating MSA and released in PDF and Excel format, three out of the four quarters in the calendar year.
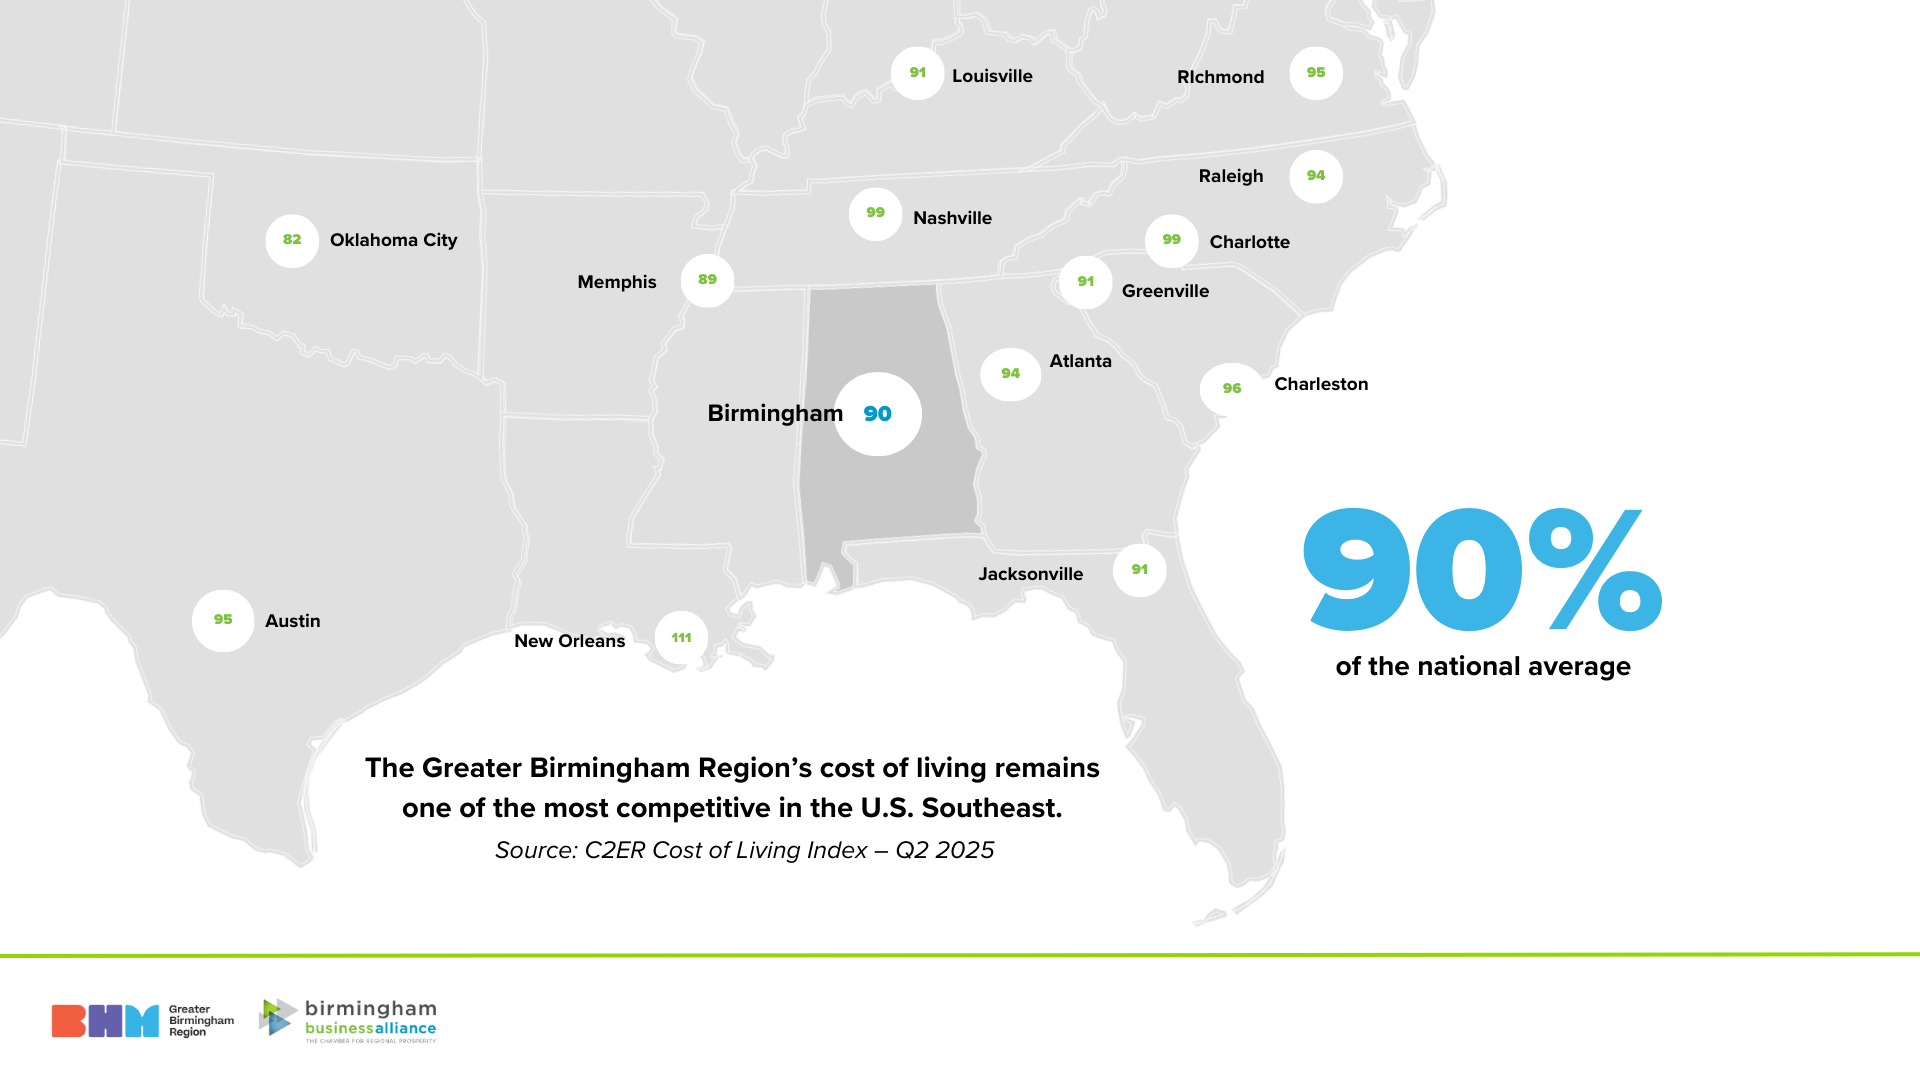
Regional Comparison: As of Q2 2025, the Birmingham MSA’s COLI is 90.3, indicating that costs in the region are nearly 10% lower than the national average.

Birmingham has an overall competitive cost of living in comparison to other metro areas, as follows:
Austin - 94.6
New Orleans - 111.4
Charleston - 95.5
Memphis - 88.5
Nashville - 98.8
Louisville - 91.1
Atlanta - 93.9
Jacksonville - 91.4
Greenville - 91.2
Charlotte - 99.0
Raleigh - 94.3
Richmond - 94.5
This matrix highlights examples of select cities and selected priced items, on average, and compares their prices to those in the Birmingham MSA.
| Priced Item | Birmingham | Nashville | Raleigh | New Orleans |
| Dozen Eggs | $5.52/doz. | $5.56/doz. | $5.95/doz. | $5.57/doz. |
| Apartment Rent | $1,068/mo. | $1,814/mo. | $1,478/mo. | $1,975/mo. |
| Gasoline | $2.79/gal | $2.80/gal | $2.87/gal | $2.84/gal |
| Doctor | $126.25 | $135.01 | $146.67 | $163.33 |
There are other metro areas across the US with a notably higher COLI than Birmingham and its peer metros:
New York - 232.0
Honolulu - 182.1
San Jose - 181.1
San Francisco - 160.1
Los Angeles - 149.4
Boston - 144.8
Seattle - 141.2
Washington DC - 138.1
Fort Lauderdale - 125.2
Chicago - 116.5
Portland - 114.9
Newark - 113.7
Wages Adjusted by COLI: Because the Birmingham metro area has such a competitive cost of living amongst peer and major metros, it can be seen as an advantage for potential talent to consider Birmingham as opposed to other metro areas. When calculating the cost of living in conjunction with the average salary, the dollar stretches much further in Birmingham than in other surrounding or competing metros.
As of Q1 2025, the average annual salary across all industries in the region is $66,269.
When you calculate the wage adjusted by the cost-of-living index (COLA), it is adjusted to $73,632.
The higher the cost of living, the greater impact it has on the salary.
COLI Over Time: The COLI is a metric that fluctuates from quarter to quarter and varies year to year. Some indexes can change drastically over time or minimally change depending on the state of costs for items across the six categories that are measured in the survey.
For example, from Q1 2025 to Q2 2025, the COLI for the Birmingham MSA only decreased by .6%, which is a very minimal difference in cost of living overall for the region.
Factors contributing to this fall into the utilities and housing categories, where we see a small decrease in housing costs and utilities costs from Q1 to Q2. There are also annual averages that are measured across the three quarters in which COLI data takes place, and an “Annual Average” report is released. This allows the cost of living to be analyzed accumulatively year over year to track how the cost of living continues to increase for communities across the US.
In conclusion, the cost of living in the region continues to remain one of the most sought-after advantages job seekers and talent look for to relocate and develop their careers or personally. Alongside the job opportunities the region has to offer, you can also live more easily without the burden of a higher cost of living that other communities face. New residents and talent can have access to all of the amenities most major cities have to offer without breaking the bank.
The BBA will continue to advocate for the region and its competitive advantages, work towards attracting more growth opportunities and talent and promote regional prosperity.
